Homework 4
In this homework, we will implement an object detector for the SuperTuxKart simulator. The goal is to look at an image and identify the locations of karts, bombs/projectiles, and pickup items. The dataset is the same as homework 3 and the starting code will look similar. You will need similar data augmentation to what you used in homework 3.
This assignment, as with all of the homework assignments, should be completed individually without sharing solutions, models, or ideas with other students. See details at the bottom of this page.
Starter Code
We provide some starter code for this homework here. This zip file contains the following:
bundle.py, a script you can use to zip up your homework for submission. In order to submit your homework, runpython bundle.py homework <uteid>which will create a file called<uteid>.zip. This is the file you should submit.gradercontains a local grader which you can use to evaluate your homework and see what grade you would currently get. Note that the local grader and our grader use different test sets, so this grader is not guaranteed to be 100% accurate.homeworkcontains the code you will modify for this assignment.
You can run the local grader at any time by using the following command:
python -m grader homework -v
We will be losing the same dense dataset that we used in homework 3. That data
should be symlinked to homework4/dense_data/.
Point-based Object Detection
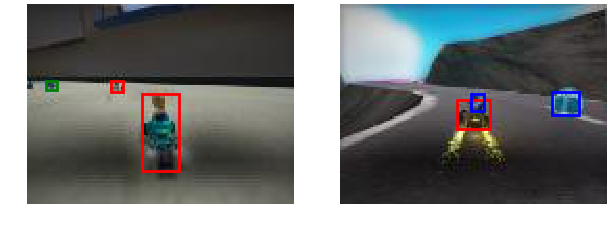
Your object detector will be based on your segmentation network from homework 3 (or the master solution). Rather than directly predicting bounding boxes, you will predict a heatmap of object centers, as in the following image:

Each local maximum (“peak”) in this heatmap corresponds to the center of an object in the image.
Peak Extraction (20pts)
In the first part of your homework, you will implement an algorithm to extract
peaks from a heatmap. A “peak” is any point which is a local maximum in some
(rectangular) neighborhood which has a value above a certain threshold. You
should implement extract_peak in models.py in order to extract these peaks.
The inputs to extract_peak are
- a heatmap with scores for each pixel,
- a window size,
- a minimum score for something to be considered a peak, and
- The maximum number of peaks to return.
If the number of peaks is larger than max_det, then you should return the
max_det peaks with the highest score, where the score is the value in the
heatmap. The return value should be a list of tuples [(s1, x1, y1), ..., (sn, xn, yn)] where each (si, xi, yi) is the score, x-coordinate, and
y-coordinate of a single peak.
Some hints:
- There may be many points with high scores near the center of an object. Make sure to only return points which are local maxima.
- You can use max pooling to find local maxima. Max pooling expects a 4D tensor
as input –
heatmap[None, None]produces such a tensor. - Use PyTorch functions to implement the peak extractor on the GPU. CPU implementations may be too slow.
Some relevant documentation:
Object Detection (80pts)
Now we’ll use the peak extractor to implement object detection. This means you’ll need to design and train a model which produces a heatmap that your peak extractor can work with.
Heatmap Prediction
You should design a FCN model which takes an image as input and predicts a
separate heatmap for each class. (That is, your output should have shape [B, C, H, W] where B is the batch size C is the number of classes, H is the
height of the input and W is the width of the input.) Each heatmap should
consist of values in the interval [0, 1] where most values are close to zero,
and high values occur near object centers.
Note that dense_transforms.py includes a transform ToHeatmap which you will
need to use in order to get heatmap labels from the dataset. This
transformation does not change the input image, but just puts the label in a
format you can use. There are several other useful transforms, which are
illustrated by utils.py try running python -m homework.utils.
The labels produced by ToHeatmap include both the heatmap labels and the size
information you might need for the extra credit. That is, iterating over this
dataset yields triples (input, heatmap_label, size_label).
Some hints:
- Use sigmoid to produce heatmaps in [0, 1] and use
BCEWithLogitsLossas your loss function. Note thatBCEWithLogitsLossalready includes a sigmoid so you do not need to apply the sigmoid before the loss function. You will want to usereduction="None"with the loss. - Start by implementing
__init__andforwardas we have been doing with other models. These are all you need for training. We will worry aboutdetectlater. - Once again, the classes are very unbalanced in this dataset. Try using the focal loss to improve training.
Documentation:
Object Detection
Once you have a heatmap, you are ready to extract object locations from it. To
do this, you should implement detect, which returns a tuple of three lists.
The three lists represent the three classes you are detecting (karts,
projectiles, and pickups) and each element of each list should be a tuple of 5
numbers:
- The confidence of the detection (a float in the range [0, 1]),
- The x and y locations of the center of the object (ints), and
- The width and height of the object, each divided by 2 (floats). This part is for extra credit. If you do not want to return the size of the bounding box, return 0 for the width and height instead.
You should return no more than 30 object locations for each class. If you detect more than 30 peaks, only return the 30 with the highest scores.
Use extract_peak to get the confidence scores and centers.
Evaluation
Your detector will be evaluated on a metric called average precision (AP). See here or here for descriptions of this metric. Briefly, average precision sorts each detection by its confidence, then measures the precision (percentage of detections which are correct) and recall (percentage of objects which were detected) for each class. Average precision is the mean value of the precision at a recall of 0, 0.1, 0.2, …, 1. For this homework, we have two separate criteria for determining whether a prediction is correct:
- Does the center value you returned lie inside the bounding box of the object?
- Is the distance between the predicted center and the ground truch center less than 5 pixels?
Notice that the dataset contains a number of small objects (size smaller than
20 pixels). We ignore these objects and do not penalize predictions that are
close to small objects. These objects are already filtered out of the dataset
inside the provided DetectionSuperTuxDataset.
The specific breakdown of points for this section is:
- 5pts for getting the right output format from your detector,
- 10pts for the performance of your detector on the inside-the-bounding-box metric on each class, for a total of 30pts (scored linearly for AP in the ranges [0.5, 0.75], [0.2, 0.45], and [0.6, 0.85] for the three classes respectively), and
- 15pts for the performance of your detector on the center-distance metric (45pts total, with the same grading as the previous line).
WARNING: The validation set is easier than the test set for this problem. The master solution achieves AP’s of 0.82, 0.61, and 0.89 on the validation set but only 0.74, 0.53, and 0.89 on the test set. I recommend trying to get your AP to exceed the maximum values by 0.1.
Extra Credit 9pts
You can earn up to 9 points of extra credit by predicting the sizes of objects along with their centers. This turns your detector into a full-fledged object detector which outputs bounding boxes rather than just center locations. The easiest way to do this is to add two more channels to the output of your network which predict the sizes along with the 3-channel heatmap. This section is evaluated according to AP at an IoU of 0.5.
Some hints:
- Add a size loss, but only apply it at object centers.
- Carefully balance the size and peak losses.
Grading
As always, the validation grader can be run at any time with
python -m grader homework -v
Note that this grader is using a different set of test data than we use for our grader, so there may be some difference between the two. The distributions will be the same so your grade should be similar between the two graders, unless the model is massively overfit to the validation set.
Submission
Once you are ready to submit, create a bundle by running
python bundle.py homework <eid>
then submit the resulting zip file on Canvas. Note that the grader has a maximum file size limit of 20MB. You shouldn’t run into this limit unless your models are much larger than they need to be. You can check that your homework was bundled properly by grading it again with
python -m grader <eid>.zip
Online Grader
The online grading system uses a slightly modified version of Python, so please make sure your code follows these rules:
- Do not use
exitorsys.exitas this will likely crash the grader. - Do not try to access files except for the ones provided with the homework zip file. Writing files is disabled.
- Network access is disabled in the grader. Make sure you are reading your
dataset from the
datafolder rather than from a network connection somewhere. - Do not fork or spawn new processes.
printandsys.stdout.writeare ignored by the grader.
Honor Code
You should do this homework individually. You are allowed to discuss high-level ideas and general structure with each other, but not specific details about code, architecture, or hyperparameters. You may consult online sources, but don’t copy code directly from any posts you find. Cite any ideas you take from online sources in your code (include the full URL where you found the idea). You may refer to your own solutions or the master solutions to prior homework assignments from this class as well as any iPython notebooks from this class. Do not put your solution in a public place (e.g., a public GitHub repo).
Acknowledgements
This assignment is very lightly modified from one created by Philipp Krähenbühl.